
An illustrated guide to data-driven questionable decision making.
I Accidentally Built a CRM This Week
Three whole days into running my own little data and AI shop on the South Shore, I hit the first problem almost every new business hits: I have a top-of-funnel problem. I need leads. Ideally local ones. Maybe some friendlies to build out a portfolio with.
So, you know, naturally, I built a CRM. I didn't mean to, I swear. It just sort of... happened.
I called it GeoOutbound. Here's the thing it actually does, and then I'll tell you why I think the whole story matters more than the tool.
What it is and How I built it:
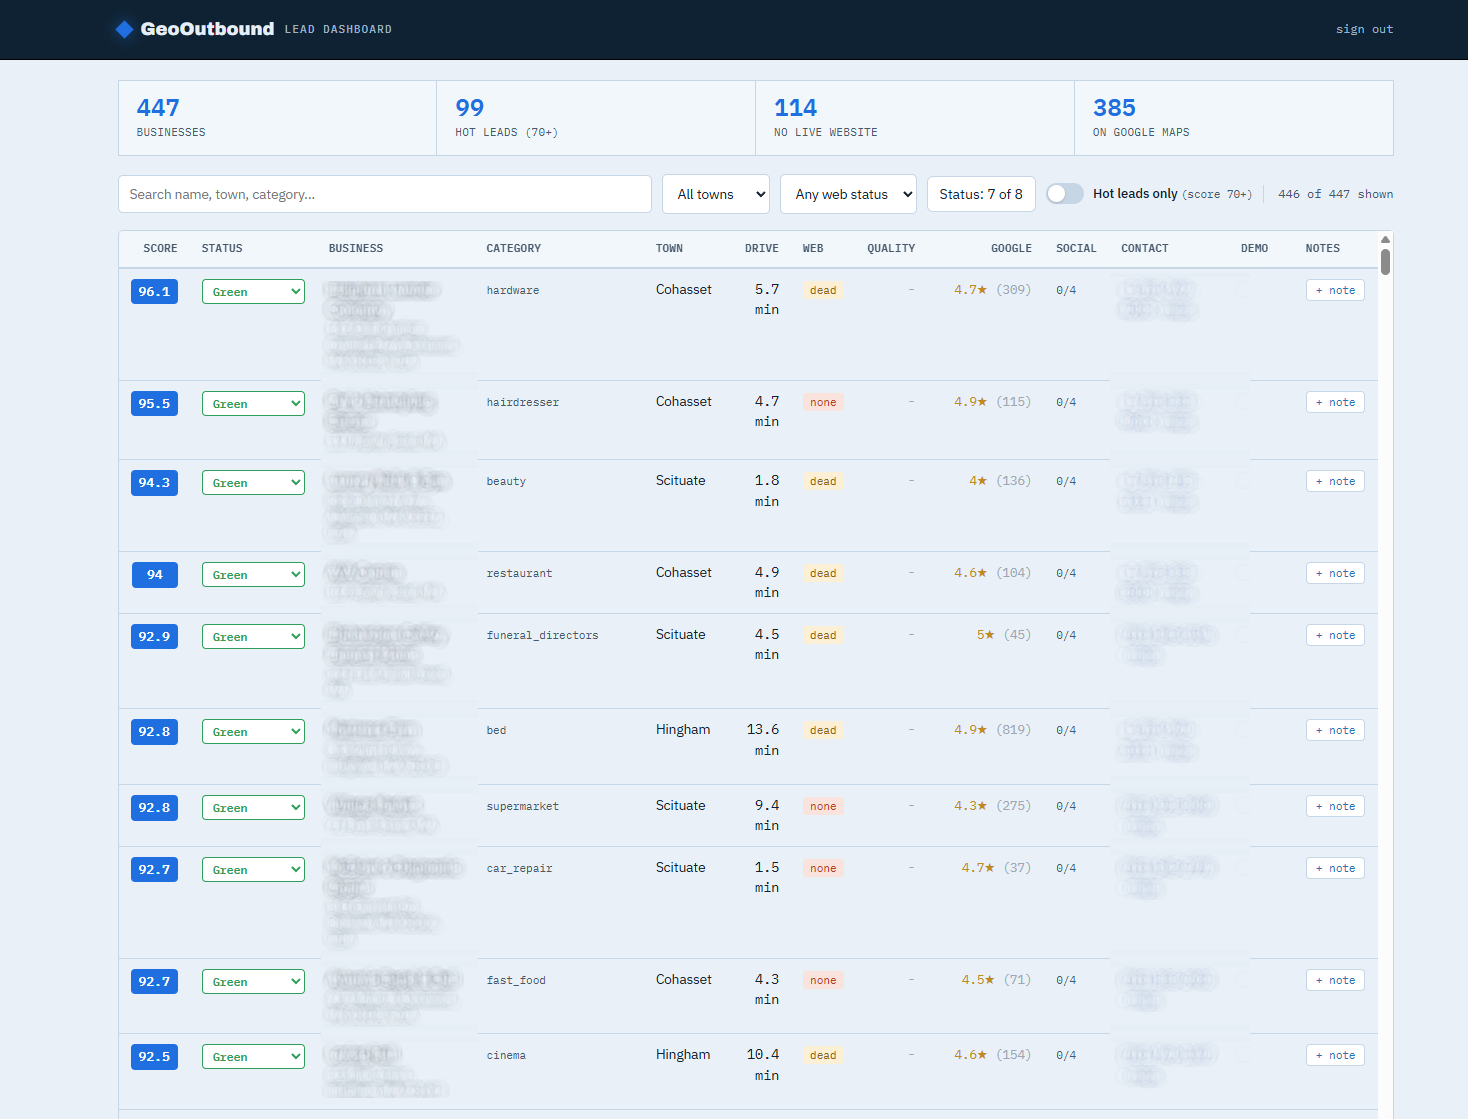
It pulled 447 businesses across Scituate, Cohasset, Hingham and the towns around them, then scored every one on how badly they need the thing I can sell them: a clean, fast website. Roughly 114 of them have no live website at all. Not a sad website. None. Dead domain, parked page, or a Facebook profile doing the heavy lifting. 99 scored hot.
Each row hands me what I need to decide whether to pick up the phone or stop into their store. I have their business name and what kind it is. The town, the address. I even have the drive time from my front door, which matters because I've done my time on the commute into Boston and I'm not going back. I pulled their Google rating and how many reviews back it up, so I can tell a beloved 30-year institution from a brand-new shop nobody's found yet. I grab their social footprint, which reads 0 of 4 more often than not. And I added a little "+ note" button so future-me remembers I already left a voicemail, and what we talked about.
“So, you know, naturally, I built a CRM. I didn’t mean to, I swear. It just sort of... happened.”
That's about it so far. Eight columns. It does exactly what my fledgling business needs today and not one thing more.

It took me longer to design my business cards. Hmm. Maybe I need to do design work, too. Anywho…
Should I have bought one instead?

Maybe my first instinct should have been to go shopping, because there's a CRM for this. There are forty CRMs for this. HubSpot will hand you a free tier and Salesforce will happily sell you a whole cathedral.
I’ve used both. Happily, well, maybe not happily. I appreciate a good system of record as much as the next fella. I've even helped Seagate Technology run on an account object with a hundred and sixty custom fields, half required, fully a quarter duplicative, and likely none filled in right. I've inherited the workflow automation nobody remembers switching on, quietly emailing the wrong people for two years. I know what that bloat costs, and it doesn't show up on the invoice.
I didn't need any of that. I needed eight columns and a notes field. No CRM on Earth is going to sell me just that, because just-that isn't a pricing tier. So I built it.
How a guy who rarely codes built a CRM

Truth be told, I'm pretty fucking slow at writing code. I’ve done it so rarely the rust never fully comes off. I came up through the data world thinking in living process flow diagrams a la Alteryx and building dashboards in Tableau, not hand-coding React components. For most of my career I’ve stayed in the kiddie pool side of technology while living on the business rules side far more consistently.
I don’t need to do that any more, and that's the whole point of this post.
“Total cost: a domain that runs me about ten bucks a year, plus my Claude Code Max license”
I built GeoOutbound with Claude Code across a couple of evenings. I described what I wanted in plain English, the same way I just described it to you, and we worked through it together. Pulling the list, scoring it, computing the drive times, wiring up the filters and the notes, getting it hosted, working through bugs and features as I went. It felt less like programming and more like having a very fast, very literal junior engineer who doesn't get tired and doesn't mind that I changed my mind about the scoring four separate times.
Total cost: a domain that runs me about ten bucks a year, plus my Claude Code Max license, which, admittedly, ain't exactly cheap, but it’s less than an hour of consulting time a month in cost. That said, the Max license also writes pipelines, debugs my website, and helps me think through client work, so I'm able to spread that cost across everything I do.
Some admissions and caveats
This is not enterprise software and I'd never pretend it is. It's a single-user tool sized for exactly where I am right now. The data goes stale, so I refresh it. The score is a heuristic I made up over coffee and keep tweaking, which is a polite way of saying it's opinionated and not even slightly scientific. There's no multi-user anything, no permissions, no audit trail, because there's one user and it's me waving at the screen.
The day I have a team, or a thousand leads, or a partner who needs in, I'll rebuild it, maybe I’ll even call up Marc and shell out for all the things. And that's fine. In the meantime, I built the version for the business I have today. Sooo fucking cool! When the bigger business shows up, I'll build the bigger tool, probably over another weekend. Today, I couldn’t even have had a sales cycle in the time it took me to build my own thing, tailored for me!
Why this makes me optimistic for the future:
This is where I get genuinely hopeful about AI and where we're headed, and I don't say that lightly because I spend a lot of my day working around gaps in the tooling’s context.
Overall, the tooling is so damned good now that a curious person with a bit of aptitude can build the exact thing their situation calls for, instead of renting a bloated version of it from someone who priced it for a company a hundred times their size. That's new. A couple of years ago, the gap between "I have an idea for a tool" and "I have the tool" was a developer you couldn't afford or a weekend you didn't have. That gap is mostly gone.
And look at where it points me. I get to build cool stuff for a living. The barber shop down the road gets a website that helps keep his chairs full. The hardware store with a 4.7 across 300-some reviews and a dead domain gets put back online for the price of a nice dinner. Nobody loses in that trade. The growth-hacker crowd was never going to call these places, the agencies want a retainer, and the big platforms want a sixty-year-old shop owner to learn a content management system on a Tuesday night after close. I can just... fix it. Locally. For a fair price. And drive home in under ten minutes.
That's the whole pitch, really. Fortune 500 data skills, scaled down for the corner store. Turns out the tools to run that pitch scale right down with it.
A few takeaways, the way I like to end these:
Build the tool for the business you have today, not the one you're daydreaming about. The small version ships this weekend, buy the enterprise thing when its absolutely necessary. The big one can wait until the revenue actually exists to support it.
True, most folks can’t just do what I did. There was a lot of lingo in the Cloudflare setup. Those twenty years of living in tech are worth something still.
There’s a real gap in my own community. I’m really excited to go find them, to serve them. That’s probably true for your community, too.
If you're sitting on a couple decades of hard-won skills and wondering whether you can do this on your own terms, from your own town: I bet you can.
I can’t wait for those business cards to arrive.

If you run one of these businesses, or you know one, or you just want to talk shop about how any of this got built, reach out. I'm over at josephschafer.com and I'm always happy to have a chat. We win together or not at all.
Overcoming Adversity - Anthropic Edition
First off, let me empathize with one of the most valuable companies in existence: Even they probably didn’t see us coming.

Obligatory GenAI Artwork, obviously thieving IP…
Yes, as you all know I’ve been Claude-pilled, whatever that means. And my timing could not have been more… interesting, given recent events. If you’re already up to speed on the recent change to Anthropic’s Subscription changes from today, skip ahead unless you like classic car analogies, custom gaming computers, and possibly doing wild shit with them and language models. Oh, that’s my reader base? Awesome. You’re amongst friends.
For those not in the know, OpenClaw lives locally on a piece of hardware you have at home. You can just have your chatbot of choice teach you how to set it up. Many folks use a Mac Mini or even a weak-ass Raspberry Pi. Personally, I tossed it on a Linux box built on an old gaming rig that somewhat controversially aged out of Windows support last fall. It was laying around with a Linux flavor already on it called Pop OS. Pop-OS works great with Steam, by the way! So, yeah, I have been waiting for Tekken 7 to go on sale so my boys and I could relive the glory days of my youth in the basement on the big tv. No need to go buy a new computer for this little side project, I figured.

Gratuitous Old School Reference!
Since it’s a retired gamer rig, it has a liquid-cooled Nvidia GeForce 2080 Super, a notorious yet powerful 2019 vintage, which in GPU years makes it the equivalent of a late 1980s Pontiac Firebird: Past its prime, leaks fluids, (literally). Noisy… Probably causes cancer. Still reasonably fast and pretty frickin’ cool though!
Now, having an under-sized local model has been fine for everyone, and many folks don’t even bother hosting one, because an OpenClaw server isn’t typically actually asked to do all that much. It’s more of an orchestrator, a front end, or a harness, that you plug in to productivity webapps, maybe host some files, whatever you can come up with that seems interesting, and then for all the heavy lifting it can offload that to Anthropic’s Claude API.
Or it could, until today. The big change today was all of us OpenClaw users was that you now have to attach the API meter to it. Kind of a pay-as-you-go model instead of all-you-can-eat. Uncapped.
The repercussions here are quite scary for power users. Certainly when I use Claude Code, which is subscription-based and has zero risk, I am prone to going ham. Yet when I burned through $1.61 in API calls Saturday morning before my second cup of coffee, well, I got a little stingy.

So, as one does, when faced with adversity, one Adapts. Improvises. Overcomes. Love that meme!
Now, you may know this about me already… I play games with my two young boys, aged 10 and 6 as of today, on big ole beefy computers that I usually build, nay, lovingly craft, myself.

This one is my latest - Finn’s Icepick
They’re always liquid-cooled and they’re state-of-the-art at the time they’re built. So, naturally, I have to fend off the crypto crowd, and now the AI crowd, for good GPUs to put in them.
It turns out, these aren’t too bad for running what I’d call the medium tier of models. Big enough to reason, yet cheap enough they don’t need to run on server clusters. And it so happens that I have three of them heating my office in the winter… and the summer. (A topic for another blog, perhaps…)
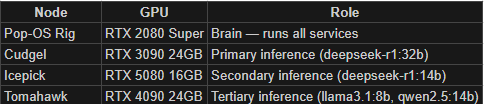

So, anyway, I started' blastin’ and by the time I was done, I had built out a 4 node cluster of inferencing awesomeness. Why? Well, because I can. And because, in some weird, obviously convoluted sense, I can be a curmudgeonly cheap guy when it comes to avoiding uncapped cloud spend on my own personal dime.

Is it not adorable?!
What next? Well, over the weekend I built a handy little chatbot thing for Discord for my guild mates. I spent about 90% of the time on the cute emoji-inspired icon. Can you guess which two emojis I mashed up in Gemini?
The chatbot pulls in data for a character from the warcraftlogs.com api, and compares it to some cleaned up data that Claude scraped from wowhead and has hosted in a SQLite database on my brains, and then spits out a pretty and formatted result. It can make recommendations for upgrades to seek and where to find them, and it can give you reasonably decent strategies for a given encounter on the fly upon request. I’m working on extending it to share some custom macros for encounters, and I hope to have it doing other odd jobs with a bit more autonomy form the clustered horsepower I’ve given it. I had spent most of the weekend really struggling because all the v1 abilities were limited by the very modest 8GB VRAM on the 2080, so with a bit more horsepower, I should be able to flex a bit more and reason through higher-order problems.
Honestly, the biggest problem I have right now, is that I’m slamming through the backlog so fast that creativity is the new bottleneck. And that, my friends, is quite the Excession. Good book and I suggest it.
How a mom-and-pop grocery store owner built an enterprise-grade analytics stack in a weekend
Things are about to get really weird
So… You may recall my post from last October where I waxed poetic about why I was leaving Alteryx behind for Databricks, and my post from November where I used ice cream sandwich sales data to catch a bug in our POS system. If you read those, you know I've been on a bit of a journey building out a real analytics stack for Three Sisters Provisions, our little grocery and café in Cohasset, MA.
What I haven't told you yet is what happened when I decided to stop dabbling and go all-in with my new bestie, Claude.
Over the past few days, I sat down with Claude — Anthropic's AI, which I've been using in a Claude Project specifically dedicated to this work — and we built something I genuinely didn't think was possible without a team of data engineers and several weeks of billable hours.
Let me tell you what we built. And then let me tell you why it matters way beyond my wife’s adorable little store.
The Stack
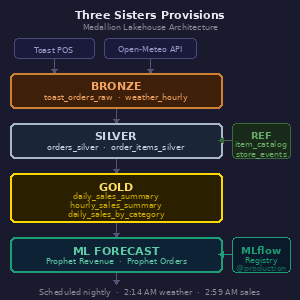
Here's what's running nightly at Three Sisters Provisions:
A Bronze layer pulls raw orders data from the Toast POS API and weather data from Open-Meteo's historical archive and forecast APIs.
Silver transforms and cleans that raw data — exploding order line items, fixing time zone issues (Toast stores timestamps in UTC, which caused some fun debugging), and building out a clean order and items table.
Gold aggregates everything into three production tables: a daily sales summary with weather, an hourly sales summary for the "how are we doing today" view, and a daily category breakdown showing revenue by product category.’
On top of that, we built a few Prophet-based machine learning forecast models — one for revenue, one for order count — both logged and versioned in MLflow, registered in the Databricks Model Registry with a @production alias, and running nightly to write 30 days of forward predictions into the same Gold table alongside the actuals.
The whole thing runs as scheduled Databricks jobs.
Weather ingests at 2:14 AM. Sales ingests and transforms and rolls up to Gold starting at 2:59 AM. Forecast generation runs after that. Every morning when I wake up, the data is current and the next 30 days of predictions are fresh.
I also built a reference table for special events — town strolls, catering days, future closures — with a little management notebook so my wife or or nephew can log a new event without touching a line of model code.
Oh, and there's a validation cell in the Gold notebook that actually asserts revenue matches Silver within 1% tolerance and will fail the job loudly if something's wrong. Because silent bad data is worse than no data.
The Mistakes Were Educational
I would be doing you, dear reader, a disservice if I made this sound entirely smooth. It was not entirely smooth.
We discovered about halfway through that a join between the orders table and the items table was multiplying revenue by the average number of items per order — roughly 4.3x inflation on every single number. The forecast model trained on those numbers for a while before we caught it. The result was a Friday revenue prediction of $7,646 when actual Friday revenue tends to be closer to $2,500-$3,000. Once we caught the root cause, fixed the join, rebuilt the Gold table, and retrained the model, the predictions came back down to earth and the implied average ticket size — revenue divided by order count — started making sense in the $20-$29 range. This sort of catch is still a human-driven value add. I also noticed Tips, which are only enabled on Online Orders, for reasons I don’t entirely understand, were flowing into Net Revenue. Big no-no.
We also discovered that Spark SQL doesn't support FIRST(col ORDER BY other_col) syntax like PostgreSQL does. And that sample_weight in Prophet's model.fit() isn't supported in the serverless-installed version. And that moving a notebook from Drafts to a shared workspace folder breaks the job task path references. Each of these is the kind of thing that costs a consulting engagement a day or two of billable debugging. With Claude, we caught and fixed them in seconds. These are examples of things that Claude figured out for me. And more often than not, solved for before I knew it was a problem. Candidly, I don’t think I knew this until the time of writing this blog together.
What This Means for Data Engineering Consulting
I say this with genuine affection for my colleagues in the data engineering world, because I have spent years selling their services: the ground is shifting under this business model.
The traditional engagement goes something like this: a client needs a data pipeline. They hire a firm. The firm scopes the work, assembles a team, runs a discovery phase, builds out the architecture, writes the code, documents it, hands it over, and charges somewhere between $150 and $400 an hour for all of the above. Two yeas ago, for a project like what I just described — Bronze/Silver/Gold medallion architecture, API ingestion, weather integration, ML forecasting with MLflow, nightly scheduling — you're probably looking at an 8-16 week engagement at a meaningful blended rate.
Folks: I built it in a weekend, often while playing games on my other monitor. With an AI. For the cost of a Claude Max subscription and some Databricks compute that I think is going to total around $50, give or take.
Now — and this is important — I want to be clear about what I had going for me. I have spent years at Databricks selling professional services. I understand the concepts, the lingo, even if I hadn't implemented them myself. I’ve done much the same work in other platforms, like Alteryx, that I was doing today. I knew enough to ask the right questions, push back when something felt architecturally wrong, and insist on doing things properly rather than patching symptoms. When Claude tried to fix a broken forecast by throwing code into a notebook rather than fixing the underlying join bug, I was the one who said "wait, let's step back and think about the root cause." That instinct matters enormously.
I'm not saying data engineering expertise is obsolete…
I'm saying the delivery model for this sort of expertise is changing in ways that should make everyone in this space think carefully.
What's changing rapidly is the ratio: The ratio of experienced human judgment to commodity implementation work is shifting dramatically in favor of judgment. The judgment — knowing what to build, why this architecture and not that one, when to be suspicious of a number, what the business actually needs from its data — that's worth as much as it ever was. Maybe more, because now the implementation can move so fast that bad architectural decisions compound just as quickly as good ones.
What's diminishing in value is the pure hours of writing boilerplate pipeline code, setting up MERGE statements, fixing timezone issues, debugging Spark SQL syntax errors. An AI assistant can do a lot of that work. Not all of it, not without supervision, and not without someone who knows enough to catch it when it's wrong. But enough of it that a 12-week engagement for a reasonably straightforward data pipeline feels increasingly hard to justify.
The Good News: What This Means for Small Businesses
Here's the thing that actually keeps me up at night, in a good way.
For the past decade or so, sophisticated data infrastructure has been the exclusive province of companies with budgets large enough to hire data teams or engage consulting firms. A retailer with three locations and $5M in revenue doesn't get a medallion lakehouse architecture with ML forecasting. They get a spreadsheet and maybe a Shopify analytics dashboard.
What I built at Three Sisters Provisions is — objectively — more sophisticated than what most mid-market retailers have. A nightly-retraining Prophet model with cross-validation, hyperparameter tuning, seasonal priors from comparable historical data, confidence intervals, and forecast accuracy tracking by horizon day. A validation layer that reconciles Gold against Silver on every run and fails loudly on data quality issues. Full Unity Catalog metadata with column-level comments. A reference table architecture so special events are maintained in one place and all downstream models pick them up automatically.
I'm a mom-and-pop grocery store. We sell sandwiches and wine and the best sourdough on the South Shore: Kneady Mama bread. And I have a more rigorous analytics stack than most companies ten times our size.
That gap — between what sophisticated businesses have and what small businesses have — is compressing fast. The question for small business owners isn't really "can I afford enterprise-grade analytics?" anymore. The question is "do I understand my own business well enough to direct an AI to build it for me?"
That second question is harder than it sounds. You need to know what questions you want to answer. You need to understand enough about your data to catch it when something looks wrong. You need to be willing to go slowly on architecture decisions even when the temptation is to just get something running. And you need the patience to iterate — because the first version of anything will have bugs, and finding them is part of the process.
But if you have those things? The tools are there.
What This Means for Businesses That Aren't Plugged In
This is the part I find most interesting from a macro perspective.
There's a class of business — probably the majority of businesses — that is going to wake up in three to five years and find that their competitors who embraced this shift have a genuinely unfair informational advantage. Not because they bought expensive software. Not because they hired an army of data scientists. But because they spent some time learning to work with AI tools rather than waiting for someone to hand them a finished product.
The gap between plugged-in and not-plugged-in isn't a technology gap. Databricks has a free tier. Claude has plans that cost less than a dinner out. The gap is a curiosity and willingness gap. The businesses that win in this new world are going to be the ones where the owner, or someone close to the owner, got curious about what was possible and started experimenting.
I'm not a data engineer. I'm a reformed Sales Ops Analyst and a sales guy with a blog called questionable decision-making. And I built a production ML forecasting pipeline. In a weekend.
The tools are genuinely accessible now. The question is whether you're willing to pick them up.

Over the past few days, I sat down with Claude — Anthropic's AI, which I've been using in a Claude Project specifically dedicated to this work — and we built something I genuinely didn't think was possible without a team of data engineers and several weeks of billable hours.
Let me tell you what we built. And then let me tell you why it matters way beyond my wife’s adorable little store.
The Stack
Here's what's running nightly at Three Sisters Provisions:
A Bronze layer pulls raw orders data from the Toast POS API and weather data from Open-Meteo's historical archive and forecast APIs.
Silver transforms and cleans that raw data — exploding order line items, fixing time zone issues (Toast stores timestamps in UTC, which caused some fun debugging), and building out a clean order and items table.
Gold aggregates everything into three production tables: a daily sales summary with weather, an hourly sales summary for the "how are we doing today" view, and a daily category breakdown showing revenue by product category.’
On top of that, we built a few Prophet-based machine learning forecast models — one for revenue, one for order count — both logged and versioned in MLflow, registered in the Databricks Model Registry with a @production alias, and running nightly to write 30 days of forward predictions into the same Gold table alongside the actuals.
The whole thing runs as scheduled Databricks jobs.
Weather ingests at 2:14 AM. Sales ingests and transforms and rolls up to Gold starting at 2:59 AM. Forecast generation runs after that. Every morning when I wake up, the data is current and the next 30 days of predictions are fresh.
I also built a reference table for special events — town strolls, catering days, future closures — with a little management notebook so my wife or or nephew can log a new event without touching a line of model code.
Oh, and there's a validation cell in the Gold notebook that actually asserts revenue matches Silver within 1% tolerance and will fail the job loudly if something's wrong. Because silent bad data is worse than no data.
The Mistakes Were Educational
I would be doing you, dear reader, a disservice if I made this sound entirely smooth. It was not entirely smooth.
We discovered about halfway through that a join between the orders table and the items table was multiplying revenue by the average number of items per order — roughly 4.3x inflation on every single number. The forecast model trained on those numbers for a while before we caught it. The result was a Friday revenue prediction of $7,646 when actual Friday revenue tends to be closer to $2,500-$3,000. Once we caught the root cause, fixed the join, rebuilt the Gold table, and retrained the model, the predictions came back down to earth and the implied average ticket size — revenue divided by order count — started making sense in the $20-$29 range. This sort of catch is still a human-driven value add. I also noticed Tips, which are only enabled on Online Orders, for reasons I don’t entirely understand, were flowing into Net Revenue. Big no-no.
We also discovered that Spark SQL doesn't support FIRST(col ORDER BY other_col) syntax like PostgreSQL does. And that sample_weight in Prophet's model.fit() isn't supported in the serverless-installed version. And that moving a notebook from Drafts to a shared workspace folder breaks the job task path references. Each of these is the kind of thing that costs a consulting engagement a day or two of billable debugging. With Claude, we caught and fixed them in seconds. These are examples of things that Claude figured out for me. And more often than not, solved for before I knew it was a problem. Candidly, I don’t think I knew this until the time of writing this blog together.
What This Means for Data Engineering Consulting
I say this with genuine affection for my colleagues in the data engineering world, because I have spent years selling their services: the ground is shifting under this business model.
The traditional engagement goes something like this: a client needs a data pipeline. They hire a firm. The firm scopes the work, assembles a team, runs a discovery phase, builds out the architecture, writes the code, documents it, hands it over, and charges somewhere between $150 and $400 an hour for all of the above. Two yeas ago, for a project like what I just described — Bronze/Silver/Gold medallion architecture, API ingestion, weather integration, ML forecasting with MLflow, nightly scheduling — you're probably looking at an 8-16 week engagement at a meaningful blended rate.
Folks: I built it in a weekend, often while playing games on my other monitor. With an AI. For the cost of a Claude Max subscription and some Databricks compute that I think is going to total around $50, give or take.
Now — and this is important — I want to be clear about what I had going for me. I have spent years at Databricks selling professional services. I understand the concepts, the lingo, even if I hadn't implemented them myself. I’ve done much the same work in other platforms, like Alteryx, that I was doing today. I knew enough to ask the right questions, push back when something felt architecturally wrong, and insist on doing things properly rather than patching symptoms. When Claude tried to fix a broken forecast by throwing code into a notebook rather than fixing the underlying join bug, I was the one who said "wait, let's step back and think about the root cause." That instinct matters enormously.
I'm not saying data engineering expertise is obsolete…
I'm saying the delivery model for this sort of expertise is changing in ways that should make everyone in this space think carefully.
What's changing rapidly is the ratio: The ratio of experienced human judgment to commodity implementation work is shifting dramatically in favor of judgment. The judgment — knowing what to build, why this architecture and not that one, when to be suspicious of a number, what the business actually needs from its data — that's worth as much as it ever was. Maybe more, because now the implementation can move so fast that bad architectural decisions compound just as quickly as good ones.
What's diminishing in value is the pure hours of writing boilerplate pipeline code, setting up MERGE statements, fixing timezone issues, debugging Spark SQL syntax errors. An AI assistant can do a lot of that work. Not all of it, not without supervision, and not without someone who knows enough to catch it when it's wrong. But enough of it that a 12-week engagement for a reasonably straightforward data pipeline feels increasingly hard to justify.
The Good News: What This Means for Small Businesses
Here's the thing that actually keeps me up at night, in a good way.
For the past decade or so, sophisticated data infrastructure has been the exclusive province of companies with budgets large enough to hire data teams or engage consulting firms. A retailer with three locations and $5M in revenue doesn't get a medallion lakehouse architecture with ML forecasting. They get a spreadsheet and maybe a Shopify analytics dashboard.
What I built at Three Sisters Provisions is — objectively — more sophisticated than what most mid-market retailers have. A nightly-retraining Prophet model with cross-validation, hyperparameter tuning, seasonal priors from comparable historical data, confidence intervals, and forecast accuracy tracking by horizon day. A validation layer that reconciles Gold against Silver on every run and fails loudly on data quality issues. Full Unity Catalog metadata with column-level comments. A reference table architecture so special events are maintained in one place and all downstream models pick them up automatically.
I'm a mom-and-pop grocery store. We sell sandwiches and wine and the best sourdough on the South Shore: Kneady Mama bread. And I have a more rigorous analytics stack than most companies ten times our size.
That gap — between what sophisticated businesses have and what small businesses have — is compressing fast. The question for small business owners isn't really "can I afford enterprise-grade analytics?" anymore. The question is "do I understand my own business well enough to direct an AI to build it for me?"
That second question is harder than it sounds. You need to know what questions you want to answer. You need to understand enough about your data to catch it when something looks wrong. You need to be willing to go slowly on architecture decisions even when the temptation is to just get something running. And you need the patience to iterate — because the first version of anything will have bugs, and finding them is part of the process.
But if you have those things? The tools are there.
What This Means for Businesses That Aren't Plugged In
This is the part I find most interesting from a macro perspective.
There's a class of business — probably the majority of businesses — that is going to wake up in three to five years and find that their competitors who embraced this shift have a genuinely unfair informational advantage. Not because they bought expensive software. Not because they hired an army of data scientists. But because they spent some time learning to work with AI tools rather than waiting for someone to hand them a finished product.
The gap between plugged-in and not-plugged-in isn't a technology gap. Databricks has a free tier. Claude has plans that cost less than a dinner out. The gap is a curiosity and willingness gap. The businesses that win in this new world are going to be the ones where the owner, or someone close to the owner, got curious about what was possible and started experimenting.
I'm not a data engineer. I'm a reformed Sales Ops Analyst and an unrepentant sales guy with a blog called questionable decision-making. And I built a production ML forecasting pipeline. In a weekend.
The tools are genuinely accessible now. The question is whether you're willing to pick them up.

Claude - if Claude were sent back in time to kill me.
What I haven't told you yet is what happened when I decided to stop dabbling and go all-in with my new bestie, Claude.
Over the past few days, I sat down with Claude — Anthropic's AI, which I've been using in a Claude Project specifically dedicated to this work — and we built something I genuinely didn't think was possible without a team of data engineers and several weeks of billable hours.
Let me tell you what we built. And then let me tell you why it matters way beyond my wife’s adorable little store.
The Stack
Here's what's running nightly at Three Sisters Provisions:
Quick Medallion Architecture Diagram
A Bronze layer pulls raw orders data from the Toast POS API and weather data from Open-Meteo's historical archive and forecast APIs.
Silver transforms and cleans that raw data — exploding order line items, fixing time zone issues (Toast stores timestamps in UTC, which caused some fun debugging), and building out a clean order and items table.
Gold aggregates everything into three production tables: a daily sales summary with weather, an hourly sales summary for the "how are we doing today" view, and a daily category breakdown showing revenue by product category.’

Illuminate the future, Saint Zuck
On top of that, we built a few Prophet-based machine learning forecast models — one for revenue, one for order count — both logged and versioned in MLflow, registered in the Databricks Model Registry with a @production alias, and running nightly to write 30 days of forward predictions into the same Gold table alongside the actuals.
The whole thing runs as scheduled Databricks jobs.
Weather ingests at 2:14 AM. Sales ingests and transforms and rolls up to Gold starting at 2:59 AM. Forecast generation runs after that. Every morning when I wake up, the data is current and the next 30 days of predictions are fresh.
I also built a reference table for special events — town strolls, catering days, future closures — with a little management notebook so my wife or or nephew can log a new event without touching a line of model code.
Oh, and there's a validation cell in the Gold notebook that actually asserts revenue matches Silver within 1% tolerance and will fail the job loudly if something's wrong. Because silent bad data is worse than no data.
The Mistakes Were Educational
I would be doing you, dear reader, a disservice if I made this sound entirely smooth. It was not entirely smooth.
We discovered about halfway through that a join between the orders table and the items table was multiplying revenue by the average number of items per order — roughly 4.3x inflation on every single number. The forecast model trained on those numbers for a while before we caught it. The result was a Friday revenue prediction of $7,646 when actual Friday revenue tends to be closer to $2,500-$3,000. Once we caught the root cause, fixed the join, rebuilt the Gold table, and retrained the model, the predictions came back down to earth and the implied average ticket size — revenue divided by order count — started making sense in the $20-$29 range. This sort of catch is still a human-driven value add. I also noticed Tips, which are only enabled on Online Orders, for reasons I don’t entirely understand, were flowing into Net Revenue. Big no-no, but so infrequent the sampling algo missed them.
In a different sense, Claude also discovered that Spark SQL doesn't support FIRST(col ORDER BY other_col) syntax like PostgreSQL does. And that sample_weight in Prophet's model.fit() isn't supported in the serverless-installed version. And that moving a notebook from Drafts to a shared workspace folder breaks the job task path references. Each of these is the kind of thing that costs a consulting engagement a day or two of billable debugging. With Claude, he* possibly she*, caught and fixed them in seconds. These are examples of things that Claude figured out for me. And more often than not, solved for before I knew it was a problem. Candidly, I don’t think I even knew this until the time of writing this blog together.
What This Means for Data Engineering Consulting
I say this with genuine affection for my colleagues in the data engineering world, because I have spent years selling their services: the ground is shifting under this business model.
The traditional engagement goes something like this: a client needs a data pipeline. They hire a firm. The firm scopes the work, assembles a team, runs a discovery phase, builds out the architecture, writes the code, documents it, hands it over, and charges somewhere between $150 and $400 an hour for all of the above. Two yeas ago, for a project like what I just described — Bronze/Silver/Gold medallion architecture, API ingestion, weather integration, ML forecasting with MLflow, nightly scheduling — you're probably looking at an 8-16 week engagement at a meaningful blended rate.
Folks: I built it in a weekend, often while playing games on my other monitor. For the cost of a Claude Max subscription and some Databricks compute that I think is going to total around $50, give or take.

Now — and this is important — I want to be clear about what I had going for me. I have spent years at Indicium AI and other firms selling professional services oriented around Databricks. I understand the platform, these concepts, the lingo, even if I hadn't implemented them myself. I’ve done much the same work in other platforms, like Alteryx, that I was doing in this project. And I know my wife’s business, because I helped build their tech stack, populate their item library, and so on. So, yeah, I knew enough to ask the right questions, push back when something felt architecturally wrong, and insist on doing things properly rather than patching symptoms. When Claude tried to fix a broken forecast by throwing code into a notebook rather than fixing the underlying join bug, I was the one who said "wait, let's step back and think about the root cause." That instinct matters enormously.
I'm not saying data engineering expertise is obsolete…
I'm saying the delivery model for this sort of expertise is changing in ways that should make everyone in this space think carefully.
What's changing rapidly is the ratio: The ratio of experienced human judgment to commodity implementation work is shifting dramatically in favor of judgment. The judgment — knowing what to build, why this architecture and not that one, when to be suspicious of a number, what the business actually needs from its data — that's worth as much as it ever was. Maybe more, because now the implementation can move so fast that bad architectural decisions compound just as quickly as good ones.
I’m proud to say that Indicium AI is leading the way. We’re an engineering-first organization and we aggressively measure, iterate, and ultimately improve upon our own value proposition.
What's diminishing in value is the pure hours of writing boilerplate pipeline code, setting up MERGE statements, fixing timezone issues, debugging Spark SQL syntax errors. An AI assistant can do a lot of that work. Not all of it, not without supervision, and not without someone who knows enough to catch it when it's wrong. But enough of it that a 12-week engagement for a reasonably straightforward data pipeline feels increasingly hard to justify.
The Good News: What This Means for Small Businesses
Here's the thing that actually keeps me up at night, in a good way.
For the past decade or so, sophisticated data infrastructure has been the exclusive province of companies with budgets large enough to hire data teams or engage consulting firms. A retailer with three locations and $5M in revenue doesn't get a medallion lakehouse architecture with ML forecasting. They get a spreadsheet and maybe a Shopify analytics dashboard.

What I built at Three Sisters Provisions is — objectively — more sophisticated than what most mid-market retailers have. A nightly-retraining Prophet model with cross-validation, hyperparameter tuning, seasonal priors from comparable historical data, confidence intervals, and forecast accuracy tracking by horizon day. A validation layer that reconciles Gold against Silver on every run and fails loudly on data quality issues. Full Unity Catalog metadata with column-level comments. A reference table architecture so special events are maintained in one place and all downstream models pick them up automatically.
I'm a mom-and-pop grocery store. We sell sandwiches and wine and the best sourdough on the South Shore: Kneady Mama bread. And I have a more rigorous analytics stack than most companies ten times our size.
That gap — between what sophisticated businesses have and what small businesses have — is compressing incredibly fast. The question for small business owners isn't really "can I afford enterprise-grade analytics?" anymore. The question is "do I understand my own business well enough to direct an AI to build it for me?"
That second question is harder than it sounds. You need to know what questions you want to answer. You need to understand enough about your data to catch it when something looks wrong. You need to be willing to go slowly on architecture decisions even when the temptation is to just get something running. And you need the patience to iterate — because the first version of anything will have bugs, and finding them is part of the process.
But if you have those things? The tools are there.
What This Means for Businesses That Aren't Plugged In
This is the part I find most interesting from a macro perspective.
There's a class of business — probably the majority of businesses — that is going to wake up in three to five years and find that their competitors who embraced this shift have a genuinely unfair informational advantage. Not because they bought expensive software. Not because they hired an army of data scientists. But because they spent some time learning to work with AI tools rather than waiting for someone to hand them a finished product.
The gap between plugged-in and not-plugged-in isn't a technology gap. Databricks has a free tier. Claude has plans that cost less than a dinner out. The gap is a curiosity and willingness gap. The businesses that win in this new world are going to be the ones where the owner, or someone close to the owner, got curious about what was possible and started experimenting.
I'm not a data engineer. I'm a reformed Sales Ops Analyst and an unrepentant sales guy with a blog called questionable decision-making. And I built a production ML forecasting pipeline. In a weekend.
The tools are genuinely accessible now. The question is whether you're willing to pick them up.
A Word to Anyone Who Thinks They Can Go It Alone
Here's something I need to say directly to a specific group of people, because I care about you: the lone coders, the self-taught data analysts, the "I'll just Google it" crowd, the folks who have built their professional identity around being the person who figures things out without help and hasn’t already embraced AI tools: That identity, held too tightly, is going to become a liability.
The pace of change in this space right now is unlike anything I've witnessed in my career, and I watched Tableau eat the Cognos world, Alteryx ruin the hand-crafted Excel pivot table market, and Databricks eat pretty much everything else since then. Each of those transitions took years, and in some ways are still happening, and that time has given people the space they need to learn, grow, and adapt.
This one is different. AI tools are not just getting better — they are getting better faster than any individual can keep up with by working alone. They are probably better than you, technically, at anything you think you’re an expert at.*
I caught more bugs, made better architectural decisions, and built more robust code in this project by treating Claude as a genuine collaborator than I ever would have grinding through it solo. Not because the AI is smarter than me — it isn't, and I had to correct it more than once on things where I knew better. But because two perspectives on a problem catch things one perspective misses, and because the AI has read more documentation, seen more Spark SQL edge cases, and encountered more MLflow gotchas than I ever will on my own.
The developers and analysts I worry about are the ones who see AI assistance as a crutch, or worse, as a threat to their credibility. "Real engineers write their own code." "If I use AI to help me, is it really my work?" I understand those feelings. I have had them myself. They are the wrong framework entirely.
The right framework is this: a plumber who refuses to use power tools because "real plumbers use hand tools" is not more skilled than a plumber who uses both. They are slower, more expensive, and more error-prone. The skill is in knowing what to build and why, not in the manual labor of building it.
“A surgeon who refuses to use modern imaging equipment because their predecessors operated by feel alone is not more admirable. They are just more dangerous.”
The professionals who will thrive in tomorrow's landscape are not the ones who can write the most code. They are the ones who can direct, verify, architect, question, and judge the output of systems that write code. The ones who know enough to catch it when the AI confidently produces a join that inflates revenue by 4.3x and nobody notices for two weeks. The ones who push back when a quick patch is offered instead of a root cause fix.
If you are a coder or an analyst who has not yet seriously invested in learning to work with these tools, not against them and not in ignorant bliss of them — I'm not judging you. I'm urging you. The window to adapt on your own terms, at your own pace, is open right now. It will not stay open indefinitely. The colleagues who are already moving will not wait for the rest of the field to catch up.
Go build something. Break it. Fix it. Ask for help. That last part used to mean asking a colleague or posting on Stack Overflow. It still means those things. It also means something new now, and the sooner you make peace with that, the better off you'll be.
Three Sisters Provisions is a grocery, café, and wine shop in Cohasset, MA. If you're on the South Shore and you haven't stopped in, please remedy that. We have excellent sandwiches, a thoughtful wine selection, and yes, we now have nightly ML forecast models running on our sales data. You can reach Joe at the contact form above, or find him in the store most mornings, probably arguing with a Databricks notebook.
Let's talk about Ice Cream Sandwiches!

Shout out to another woman-owned business! These are amazing!!
Today we’re going to talk about the most delicious topic you’ll probably read all year in Analytics: Nightingale Chomps Ice Cream Sandwiches!
If you haven’t seen these yet, you need to run out to your favorite bougie grocery store and get you some. Might I suggest Three Sisters Provisions, if you happen to live on Boston’s South Shore?
This journey, dear reader, walks you through a simple story of data validation via Databricks where, because we invested in an independent record of our sales, our tiny mom and pop shop was able to find a critical reporting error in our POS system’s Item Library, report it, and ultimately make a better data-driven decision around restocking some of our most popular items!
The first lesson! Trust your ice cream sandwich-filled gut.
So, a bit about Ashley and I: She doesn’t have a sweet tooth. I most certainly do. Her inventory generally reflects a more mature set of taste buds, whereas mine are as juvenile as the average Kpop Demon Hunters viewer.

Wait, did he just make a random Kpop Demon Hunters reference? Yes… Yes, he did.
Her first order from Nightingale had Chocolate Blackout, Key Lime Pie, and Strawberry Shortcake. We did pretty solid sales of Chocolate Blackout and Key Lime, but less so the Strawberry Shortcake in our opening weeks.

Sprinkles… mmm, sprinkles.
So one Sunday morning, I took it upon myself to do the reordering for this brand, and I noticed they had other flavors, some of which our two boys would most definitely want to try, others, like Mocha Brownie, were right up my alley. One, in particular, that caught my eye, turned out to be the main subject in our data story: Birthday Cake Chomps 4-pack. You see, my 6 year old has never seen a sprinkle-covered product he doesn’t like. My purchasing theory was that he’s a pretty good proxy for all the other little ones coming in with their parents into our store and that we should probably cater to them. So, on that basis, I ordered our first batch of 7 Birthday Cake Chomps around two weeks ago.
When you’re in the retail biz, one thing I recommend you do, because it’s delicious, is try the new stock. So one night I pulled a box from our order, brought it home, and let the boys try it out. No surprise, they loved it. Fast forward a couple weeks, and we only had one box left in stock. For those math majors at home, that should mean we had actually sold 5 boxes of Birthday Cake Chomps. However our sales were all off. It only showed 1 sale from that original order. Our Retail Library confirmed our stock was accurate, and that meant there was no shrinkage at play, but a whole slew of curious details were off, from sales to revenue generated.

Notice a problem? It’s impossible to have 6 orders in 7 days and not also have at least 6 orders in the past 30 and 90 days.

Ralph, failing as hard as Toast’s sales math
The data has changed since I reported the issue, but not in a particularly good way. An example of the inaccuracies appearing today via our Retail Library is the fact that we show only one sale of Chocolate Blackout in the last 7 days, but nine in 30 days and again only one again in the last 90 days. That’s unpossible!

Houston: We have a problem.
In fact, the issue today seems to be a bit worse than it was when I first caught the problem. Here’s the latest sales data from our “system of record” on orders in the last 7, 30, and 90 days.
This also shows up in the currency denominated sales columns.
Now, if I had no independent record of our sales this story would be just about over. I’d have had to trust my ice cream sandwich-filled gut and file a vaguely worded support ticket like “Hey folks, ah, this seems weird can you check in on it?”
However, I had so much more to offer because I am armed with a super power: A whole retail POS data dump, exported from its API and structured in a (reasonably) clean Delta Table stored in Databricks built entirely with Databricks Assistant.
Quick detour, so you know a bit more about me, and why the data I’ll show you next looks a bit weird: I’m a nut for clean data. I also suspect this might be a solid lead for why the data looks off in the way it does. When you use our POS system to scan in new inventory, it makes up the name of a given bar code using an LLM. It’s pretty cool, but it can be a bit inconsistent, probably due to the different ways it shows up in other retail establishments data. One delicious flavor scans in as “Nightingale Mocha Brownie” whereas another scans in as “Nightingale Inc. - CHOMPS Chocolate Blackout 4 pack”. Yuck - Eww, and Gross!
As you might imagine, as a reformed data analyst, this causes me a small degree of distress. I’ve sought to standardize the names of all of our products around a “Brand Name - Product Name (optional size variation)” nomenclature, but I have to do so outside the heat of the moment when melty stock shows up at our doorstop, because no one likes melty ice cream sandwiches!
Once stocked in the freezer and cleaned up, the sandwiches and their data looks great and the clean names help to distinguish between similar products across two different brands. Imagine “Chocolate Chip Cookie” and … “Chocolate Chip Cookie” as compared to “Piping Plover Co - Chocolate Chip Cookie” versus “Chips Ahoy! - Chocolate Chip Cookie”. It’s actually really important when reporting sales and making restocking decisions.

Entropy, as imagined in Kpop Demon Hunters
Ok, so now that you know that I’ve been working against entropy in the form of temperature while also working against, well, entropy in the form of weird results from some AI-embedded naming model, you can see for yourself how our displayNames have evolved over the course of the past month. Also, I still have some work to do, apparently, in cleaning up the names!


So, what you can see here is that we’ve made some sales under legacy names, and then made more sales under newer, standardized names. At the time, the issue seemed to be related to how the POS system was only reporting based on the newer, standardized names. I’m less certain of that fact today, but it seemed plausible at the time. What I can say, is that it’s been delightful using the Databricks Assistant to help explore the data. A good example is this prompt, and the associated code.

This would have taken me significantly longer in a drag-and-drop UI like Alteryx.

Chomps Classic was only introduced in our second order, and it’s currently in the lead in sales and revenue!
So, whereas my “system of record” says I’ve variously only sold one or two Mocha Brownie, I’ve actually sold four, and regardless, my personal favorite Nightingale Ice Cream Sandwich is in danger of being cut from the roster.
The obvious takeaways from all this are threefold:
You need to externally validate your systems of record.
Databricks is a great platform for even non-coders to do so.
Please go buy some Mocha Brownie Ice Cream Sandwiches from Three Sisters Provisions.
“But Joe” you might be saying, “I don’t have a team of people who can set up Databricks in a robust, high security environment required for my Enterprise”. Well, do I have the team for you! Give me a ring, and I’ll connect you to the excellent data professionals at Indicium. We’ll get you sorted out, migrated from your legacy platforms, with fresh data landing in your very own Delta Tables on Databricks where you, too, can leverage Databricks Assistant to get fresh answers to your pressing questions about ice cream sandwiches… or whatever else you might care about!
Why I'm leaving Alteryx behind and implementing Databricks in 2025
Try Databricks For Yourself - I’m glad I did.
Here’s my story, my reasoning, and what I can do to help you get there.
My Past: Alteryx as the Essential "Swiss Army Knife" for non-codeR Analysts
A decade ago, around 2015, I discovered Alteryx. For me, as someone who rarely coded, it was a game-changer. It was the "Swiss army knife" I needed to ingest, shape, and aggregate data for my Tableau dashboards. Back then, Tableau had rigid data structure requirements and a lot of work needed to be done before putting data into it in order to build effective reports for executives. At the time, Alteryx was the perfect tool to bridge that gap. I loved it; it was fantastic and compared to any other option, it was easily the best product on the market. It was so good, that I made championing Tableau and Alteryx the focus of my career for the next five years.
The Present: A New Era and the Evolution of Databricks
Fast forward to today. We are in a completely different era, driven largely by advancements in large language models, but also by advancements in the ease of use in adopting the Databricks platform. They’ve done a whole lot to democratize it for all knowledge workers.
Truly, in the past year or so, Databricks has evolved from a niche, complex tool for big data into a powerful, accessible platform for everyone. That’s a pretty bold statement, so maybe it’s helpful to share a bit about how we got here and what’s changed?
Databricks in 2022: Was a bit like a finicky "Muscle Car"

Back in the olden times of 2022 maybe even 2023 or early 2024, Databricks was primarily seen as "managed Spark." It was incredibly powerful for massive data volumes but also hugely intimidating for someone less technical, like me. It required significant tuning and configuration—much like an unreliable muscle car you wouldn't dare drive unless you were mechanically savvy. I wouldn't go anywhere near it at the time.
Databricks in 2025: The Accessible Platform

Today's Databricks is a completely different beast thanks primarily to two key changes and a lot of other smaller details that exist under that hood. To continue torturing my car metaphor, it’s like a Rivian R1T Quad Motor Launch Edition. It can haul massive amounts of data, but it also goes from standing still to 60 miles an hour in 2.5 seconds. It’s easy to drive, versatile, and deeply satisfying.
Ah, we’re still talking about Databricks, right? Yes! Yep.
The First Key Change: Databricks’ Serverless offering
Serverless, which means you don’t have to provision bundles of hardware called clusters, does the work to abstract away all the complexity of managing those clusters, sizing them, turning them off to save money, all that... I no longer have to worry about: Cluster sizing, whether a cluster is left on too long, or hemorrhaging cash due to misconfiguration.
I’ll be the first to advise that Databricks does charge a bit more for a given action when using Serverless instead of the much more complex to manage “classic” compute model, but the benefit for small shops is immense. For my mom-and-pop business, I am willing and able to use Databricks for analytics because the risk of a costly misconfiguration is drastically lower. To date, I’m about $30 dollars into my bill, except they do have a brief free window for new users like myself.
The Second Key Change: Databricks Assistant, an LLM for working with data
The advent of LLMs within Databricks for writing code is the second crucial change, and I cannot emphasize enough how powerful this is for less technical folks like myself. Compared to Alteryx, it makes dragging and dropping tools onto a canvas feel like using an abacus when everyone else has a calculator.

Now, I do have a modestly technical background: I’ve written a little Python, some JavaScript, and a fair bit of basic SQL, so I generally know what to expect from code that I read. However, like 98% of the population, I'm terrible at actually writing code simply because I do it so rarely, maybe I write a couple hundred lines of code every few years or so.

So to be able to bust out an entirely new pipeline of code to grab a given location’s weather data from the National Weather Service in just a half hour or so, and incrementally ingest that data into a Delta Live Table, that’s pretty amazing.
A Radically Lessened Learning Curve
Together, these two innovations have radically lessened the learning curve for adopting Databricks. Sure, if you’re going to do this in an enterprise grade environment, you’ll probably want considerable help along the way - And that’s a big reason why companies like Indicium exist: We’re great at managing the change and reducing the friction that comes with doing large data, analytics, and AI migrations. In fact, we offer a free Alteryx-to-Databricks migration assessment for well-qualified candidates. And if you’re curious, or you’re already going down this same path, please reach out to us via the form above, or reach out to me directly, at joseph.schafer@indicium.tech today and we’ll have a chat.
But maybe you’re not there yet, maybe you’re a bit skeptical. That’s ok, because Databricks has a free edition, so there’s nothing stopping you from checking it out for free on a personal account, just so you can confirm the bold claims I’m making here! In fact, that’s what I did over the summer, because I was wondering how all these advancements might play out for someone like me.
Seriously, go check out the free version, here. I did this myself, all before I went out and started building out my project within Databricks for my side hustle. I needed to see this new world, risk-free, for myself and you can too! If your organization is starting to get serious about a migration, or perhaps you’re not getting the value you expected, reach out to me. We’re here to help get you on your way to the modern data stack!
So what’s next?!
I’m so glad you Asked! Well, I’ll share a bit my own personal journey over the coming weeks, so you can get a bit more of a flavor of what the day-to-day experience is like, building out a mom-and-pop analytics hub in Databricks.
I have pretty big ambitions. I’m working on building out a weather table from the National Weather Service, because rainfall and temperature seems to have a huge impact on our foot traffic. It’ll also give me the chance to try out some of the more interesting AI features within Databricks around data science workloads.
After that, or perhaps before - my roadmap is fluid - I want to pull in inventory data. Toast’s inventory API isn’t public yet, so I’m waiting on getting access, or clarifying what access I might already have. Then I can start to focus on inventory turns, and predicting stockouts based on weather forecasts. Basically some of the coolers things that Crisp does, but for lil mom and pops, since they only play with the biggies.
On Technical Selling and Technical Discovery
An oft-repeated tenet of technical selling or even software selling in general, is ‘sell on value’. It’s a sentiment I agree with one hundred percent. It gets me out of ‘software shill’ category in the minds of my prospective customers and towards ‘trusted advisor’ territory. But to do that, I first need the chance to actively listen to their problem Then I can demonstrate that I understand their pain, I can quantify it, and that I care about the customer’s outcome. Once I'm knowledgeable about my customer’s challenges, if all has gone according to plan, I even come equipped with a solution.
The first mistake I see folks make in the buying process is that a customer - or occasionally a seller - wants to skip the step I call technical discovery. To understand the pain of a customer, I, like any technical seller, first need to listen. Any good technical seller is one part therapist, one part technical geek, one part business consultant. I listen, I apply technologies and processes, and only then can I consultatively suggest solutions, at least some of which I’m hopefully selling.
If there was one concept I would want my prospects to understand, it’s that a demo doesn’t offer them the full value of what technical sellers bring to the table. For my part, as a seasoned technologist, I’ve seen some stuff in my day. I’ve seen at least a few Fortune 500 companies running on Excel spreadsheets passed back and forth through email. I’ve written hundred lines long logic trees to clean up messy customer master data. I’ve seen customer master tables sitting idle in a database because nothing maps to it. I’m here to help and I have a plan.
Of course, I want to show customers my product in a demo! I get tingles of excitement every time I do a demo. But more importantly, I want to see and understand their specific challenges. I want to hone in on the problems I can solve with you and ultimately to help build a business case and pitch that case to stakeholders for solving those problems. As technical sellers, we’re here to help our customers be successful - we know the optimum outcome is when we all win together. The best of us are incredibly invested in the success of our customers and we can only maximize our true value to our customers when we’ve started by understanding a customer’s pain.
Adventures in Marketing: The Highlights
A few years ago, in a foray outside my normal sphere of influence, I spent a few months working cross-functionally to build out an elaborate Executive Marketing Dashboard for the Marketing team at Seagate.
First, some context: In the past, the Marketing department's leadership has driven their monthly meetings through PowerPoint presentations. Much of the normal work for analysts across the department would grind to a halt while data was pulled, groomed, graphed, and compiled into slide decks. Leadership was looking to move to Tableau to stabilize the subject matter, track to consistent goals, and drive the business through an automated set of instruments.
A recent copy of the Executive Marketing Dashboard
I was lucky enough to have some spare time at work around the holiday season of 2016, and while browsing the jobs list for a friend, I noticed an intriguing job description for a Marketing Analyst. The post's technical needs were consistent with my capabilities, but the experience within marketing was lacking. That, and I really enjoy my current job. On a lark, I reached out to see if I could share how my team does what it does, in exchange for some hands on experience into the marketing world. And that's how I found myself as the technical owner of Seagate's Executive Marketing Dashboard.
Know your Audience, NOt just your Data!
Whenever you're building a dashboard, it's crucial to understand both your data and your audience. There's a relationship there, between the two, and it will emerge in a properly designed dashboard.
In my experience, executive management generally needs to stay at a high level view of their business. In the case of the EMD, the need to stay high level was emphasized by the sheer number of topics getting presented within a relatively short forum.
So rather than designing the dashboard as a drill-into-detail dashboard, this was serving to smoothly transition management from a static, PowerPoint presentation into a new world of interactive analytics. The requirements I was given included some strict guidelines: No filters, no drilling. Management wanted it to essentially be a one-pager, with 10 different visualizations based on 10 different data sets, all on the same page. Right off the bat, this means every viz has to be crafted with an attention to dramatic spacial constraints: each one was going to get only about 300 x 400 px worth of room. Fortunately, since filters and parameters take up space, these requirements weren't at odds with one another.
Do not adjust your screen
This causes text to scale differently.
For better or worse, management tends to skew towards both towards farsighted folks and owners of fancier Windows computers with higher resolutions, which tends to mean they use a higher DPI scaling setting.
Enter: the Long Form View. Each viz in the main dashboard is reproduced on a longer form dashboard, and thus are given ample room to breathe, solving for both Window's scaled up fonts and the 50+ crowd that forgot to bring their reading glasses to the meeting.
EMD's Long View, with buffer and goal parameters visible, giving mgmt the flexibility to tell their own story.
Choose your own ending: Buffers
One benefit of presenting the vizes in two different ways, I was able to sneak in a bit of clever instrumentation that I call buffers. If you build a set of calculations that finds the minimum and maximum values on a chart, and then add a "buffer" constant to them, you can sneak in a hidden reference line which has the subtle effect of re-calibrating the scale of the axis it is built upon.

So, if normally your line chart looks as jagged as the Rockies, you can alter a parameter that drives the buffer constant (I guess it's a variable now) to scale out the axis such that the peaks and valleys are no more thrilling than the rolling hills of Ohio. Now, I know this isn't scientifically sound, tinkering with the axis like this, but remember, we're working for Marketing today, not Engineering!
Like I said, you gotta know your Audience!
Show a lot of data in a little space
The biggest visualization challenge I had was how to display all the data for the Amazon Marketing vizes. I had two categories of advertising, AMS and AMG, which had their own vastly different scales, their own goals, spend, revenue, and the relationship between revenue and goal. So right off, they need to be separated.

Because there was so much to track, I needed to find ways of keeping the rev-to-goal obvious, without being overwhelming. Since the most important factor is "did we make goal", that point is emphasized in redundant ways. With the color scheme implemented in three ways, combined with the check/x symbols, it is crystal clear which quarters met goal.
At that point I still hadn't shown spend relative to goal beyond a pass/fail, so I added goal lines based on a monetized goal. The goals are multiples of spend, so I built a calculation based on parameters. Then I drew goalposts using reference lines. In this way, viewers can also easily see how well we did relative to goal.
Getting to know Marketing data
I spent the overwhelming majority of my time getting to know - and automate - the data sets involved in this dashboard. The data sets are diverse enough in origin and type that most merit their own blog posts. I'm quite proud of my work on this project because not only did I accomplish the primary goals of building a viz tailored for my audience, but the data sources are automated and in all cases, such automation had never been achieved within Seagate. No one in Marketing, to my knowledge, had automated Google Analytics into Tableau, and no one had ever automated Sysomos and iPerception data into Tableau using their respective APIs. This aspect - blazing a trail, proving out and sharing these huge quality of life improvements for my fellow analysts, that has been immensely satisfying to me. The weeks and months since have been dedicated to training up my fellow analysts on how to take these lessons and expand them to all their day-to-day reporting.
A few highlights from that adventure:
Pulling data out of Google Analytics into Tableau via Alteryx.
Using an API and the Download Tool to pull Sysomos' sentiment data.
Connecting to SFDC to leverage CRM data and track marketing programs
For the entire dashboard, the goal was an automated dashboard that pulls nine different metrics from six very different data sources:
Click Thru Rate via Google Analytics
Time on Site via Google Analytics
Sessions via Google Analytics
Amazon AMS Spend, Goal, & Revenue via Google Sheets
Amazon AMG Spend, Goal, & Revenue via Google Sheets
Master Marketing Budget via Excel on a shared network drive
Social Media Followers via iPerception
Internet Community Brand Sentiment via Sysomos API.
Email Marketing Engagement and Purchasing via SFDC and Business Objects
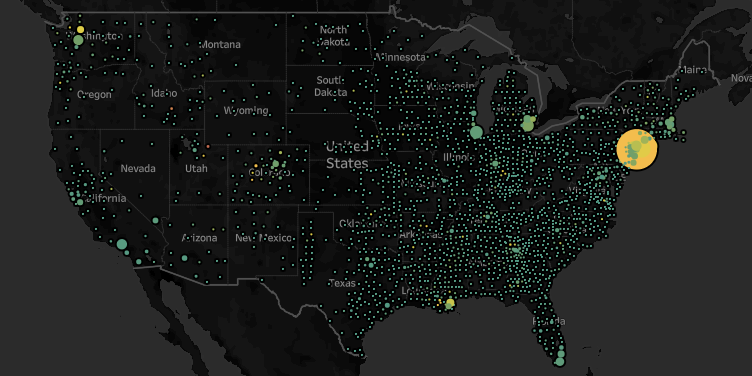
Under Pressure - a look at the US healthcare system one month into the Covid 19 pandemic
Like everyone else, coronavirus has been disruptive in ways I’d never seriously imagined. And yet, having lived for the past few years in a remote corner of Silicon Valley, life is not quite so different than my norm. I’ve always socialized primarily through virtual means, so my dance card has been largely unaffected. I was already getting groceries delivered as the norm, just to cope with the rigors of raising two young boys.
But I recognize the mathematical scale, the near inevitability of a pandemic, once mature, of what’s about to wash over us all. I’ve been spending some time using my data prep and data visualization skillsets to produce some rough ideas of what’s going on in our nation.
Of course, I used Alteryx to wrangle all my data together. You can download (but not run, as it does use the download tool) the workflow here.
In this case, I used the NY Times dataset that provides county level caseloads. I used the Alteryx Business Insights data package to provide county and state level populations. I used an internally shared hospital beds dataset as well as a kss.org dataset on beds per capita. The former provided county level detail while the latter was strictly state level. If nothing else, they validate that the aggregate hospital beds nationwide is roughly between 800k and 1M. Again, I’m strictly looking for directional indicators, so even if I’m off by 20%, that’s ok for my purposes.
https://public.tableau.com/profile/josephschafer#!/vizhome/TimesC19Exploration/CountyCasesBeds
Truth be told, I’m rehashing a thesis that I tested back in 2014, when I was a candidate for a Sales Operations job working for Michael Mixon at Seagate. An ebola outbreak was ravaging West Africa and I made a prediction that while Sierra Leone at the time had the fewest total cases, their healthcare capacity was already maxed out, and thus forecast that they were most in need of assistance and triage. As my candidacy progressed, Sierra Leone took the lead in cases and consequent deaths and my thesis proved broadly correct. The world started seeing cases pop up outside of its origins, the US, among others, rallied to the cause, and we managed to avoid the worst case scenarios.
Early February this was on my radar, but it did seem like we had a chance to get ahead of this. Obviously that didn’t happen, and by late February I saw this likely to be an issue as China’s numbers came out started looking looking a little cleaner than one should expect - they still do, frankly, but that’s another story…
At any rate, what I see are some very intense caseloads relative to healthcare capacity in particular patches. I use either hospital beds or hospital beds per capita, (depending on the granularity of the data) and arrive at a rough approximation of a supply/demand analysis.
All the headlines out of NYC tend to validate the conclusion that as cases tread even close to the count of beds, the healthcare system is overburdened and more bad news will follow. And strikingly, Summit County, UT, which is currently the upper bounds for the cases/beds metric, is indeed suffering.
If you’re a data geek like me, check it out on Tableau Public. Reach out at Joseph.Schafer@Alteryx.com with questions, ideas, etc.
A Tableau-based Row Level Security Primer
I wanted to share some of the most useful Row Level Security articles that I’m aware of and talk high level about one of Tableau’s newer features, ‘multi-table extracts’. I’ve deployed all these solutions as a customer at Seagate, once upon a time, so I’m happy to connect with other Tableau Champions and guide them through the minutiae of implementing this.
“The most common misconception with Row Level Security is that you must duplicate data to make it work in an extract - This is not true and I’ve implemented alternatives successfully at scale. ”
A quick summary of my experience with Row Level Security in Extracts is this: You can automate extracts to refresh even on an hourly cadence to get near-real time data that performs at scale. The most common misconception with Row Level Security is that you must duplicate data to make it work in an extract - This is not true and I’ve implemented alternatives successfully at scale. You can use your preferred security tables and extract them to be updated hourly.
So, with some thoughtful data preparation or even just a minor reconfiguration, one can get near real-time data in a performant Hyper extract that’s sitting on server and from there you can apply row level security to it. It’s a win-win, as you’re no longer dependent on an under-performing data platform for a live connection and when resorting to extracts, you’re not suffering the performance impact caused by inflating data with cross joins to duplicate data to set up row level security.
Multi-Table Extracts
https://www.tableau.com/about/blog/2018/10/you-can-now-choose-multiple-table-storage-extracts-94776
Because we now offer multi-table extracts, that’s another great option for solving the explosion of data due to row level security and there’s no data prep involved. In the example below, you could have two tables like the following:
[Account] | [Authorized User]NetApp | Antonia KealyNetApp | Joe SchaferJoined by Account to:
[Account] | [Qty]NetApp | 100Creating a denormalized data set like this:
[Customer | [Authorized User] | [Qty]NetApp | Antonia Kealy | 100NetApp | Joe Schafer | 100
But because we’re storing them in the extract without joining in advance, it’ll only ever need to query one row and the data set won’t be duplicated in advance! So, in short, we have lots of ways to efficiently scale Row Level Security in Tableau! I’m happy to help folks work through some POC use cases on this topic. For reference, there may be cases where Multi-Table Extracts aren’t as desirable as the fancier option of creating a concatenated string of authorized users. Chiefly, when you already need to prepare the data in advanced ways, or you want to asynchronously pull your ‘metrics data’ compared to your ‘authorization data’. For example, if your metrics data is so large that you can’t pull it more than once a day, but you want the authorization data pulled hourly still, that might be a good scenario to prefer one option over another.
Recommended Reading on Row Level Security:
General overview:
My former manager’s blog on how we implemented RLS at scale at Seagate using a hybrid approach of Active Directory groups and row level security. Note that not mentioned in his blog is a trick that shows up in the Part 2 article at the bottom of the list, where we later optimized our extract sizes using some data prep tricks.
Some additional strategies for implementing Row Level Security in parts 1 and 2:
The short version of the final article is instead of having two rows to give access to a NetApp row of data for two individuals with authority to see NetApp’s row of data, we’d have the latter single row of data, which, at scale, will drastically reduce the size of extracts.
Instead of this:
\\ filter logic: username() = [Authorized User]\\ returns TRUE for Antonia and Joe[Customer | [Authorized User] | [Qty]NetApp | Antonia Kealy | 100NetApp | Joe Schafer | 100Use this:
\\ filter logic: contains( [Authorized Users] , username() )\\ returns TRUE for Antonia and Joe[Customer | [Authorized Users] | [Qty]NetApp | Antonia Kealy, Joe Schafer | 100A Mueller Report Wordcloud, or Who Needs Regex Anyway?
It’s Thursday, April 18th, 2019. Which means, for Americans and the world, it’s officially Mueller Time!
That said, it’s a workday and I don’t really have time to read 440 or so pages written by lawyers, even legendary lawyers, like the crew on the Special Counsel’s Office. What I do have time for is a word cloud. I’ve never really made a word cloud before, so let’s get to it! Here’s one flavor of the finished product. Simple, elegant, and quite Soviet.

Step one: Find some words!
Find some words. (Done.)
While the original report is not searchable, a variety of folks have now offered searchable versions. I found mine on Google Drive.
Copy/Paste the words from a searchable PDF into a powerful word processor.
Notepad didn’t work for me. For some reason the clipboard was too big for Notepad. I first used OneNote, but I was worried it wouldn’t support the next step.
So, for this I resorted to Notepad++ because my next step is to get this into a single column of words (and garbage characters, symbols, and numbers)
In Notepad++ I performed a find/replace on all the spaces ‘ ‘ to convert them to carriage returns.
This was my reference.
Open my file in Tableau Prep for cleaning.
Rename my column “Text”
Clean -> Remove Punctuation
Clean -> Remove Numbers
Create a calculated field to clean up some of the weird remaining special characters
Sort the remaining text in descending order. This will naturally do so by count([Text]) and exclude the common English language words that aren’t pertinent. Examples would include common articles, helper verbs, etc. “the”, “to”,”of",”and”,”that”,...
This part’s got a bit of subjectivity to it, but my frame of reference is that ambiguous words or even less evocative words, like pronouns, “him”, “his”, “I”, aren’t helpful to the viz. I made this an iterative process.
Lastly, and this is something one could also do in Tableau, but is useful to understand how to do in Tableau Prep Builder, I’m going to filter out the words with singular instances. I know this data set is going to have a long tail and much of these instances are either garbage data, due to the nature of reading in a PDF image and converting it to text, or it’s just not going to appear on the word cloud anyways, so this keeps the data set a bit more manageable.
First, and this is the interesting bit, duplicate the [Text] Field, because in Prep Builder, you need one instance to Group By and one instance to Count() or otherwise to aggregate.
Then, add an Aggregate step, and put the original [Text] in the Group By side and the duplicated [Text] in the Aggregate side and set it to Count.
I then Joined the original Data set to the Count, because what I really want is to let Tableau do the aggregations after I filter out the least commonly used words.
Add another clean step and filter by calculation. I opted for >= 10 because I want this data set to perform reasonably well.
If you still see ‘common’ words which aren’t interesting, revisit Step 5 or exclude them in Tableau.
Output to a Hyper file and build out your Word Cloud in Tableau.
I also opted to filter out additional ‘ambiguous’ words in Tableau Desktop.
I built a filter in Tableau Desktop to further limit the # of words by count. I settled on about 60#, which kept the viz manageable.
You can find my workbook on Tableau Public: https://public.tableau.com/profile/josephschafer#!/vizhome/MuellerReportWordCloud/MuellerReportWordCloudrwb

